





Heat (and volatility) rising: Signs of early climate change
Over recent years, Australia’s east coast has faced a marked increase in extreme weather events. Severe bushfires have caused widespread damage to communities and ecosystems, while unprecedented flooding has inundated entire towns. What stands out is how often they now appear as part of the same broader pattern, rather than as isolated or unrelated events.
What brings this pattern into focus is long-term analysis of Bureau of Meteorology data, particularly when examined using regression techniques rather than simple year-to-year comparisons. In our work we are seeing, across much of eastern Australia, a divergence between rainfall measured over longer periods and rainfall measured over shorter ones. Monthly and annual rainfall totals are often flat or declining, while rainfall measured over daily, intra-day or short-duration windows is flat or increasing in intensity.
This divergence becomes understandable when temperature data is considered. Maximum temperatures are rising more clearly than averages, while rainfall is increasingly concentrated into shorter, heavier bursts rather than being spread evenly across weeks or months. The result is a climate marked by prolonged and hotter heatwaves, more intense bushfires, and severe flash flooding.
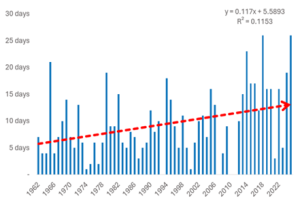
The physical explanation is straightforward. Warmer air can hold more moisture, increasing the intensity of rainfall when conditions allow precipitation. At the same time, higher temperatures increase evaporation and drying between events. Together, these effects point to increasing volatility, rather than a simple shift towards wetter or drier conditions overall. Analysing long term data trends over 75 -150 years reveal these changes as being distinct from natural baseline variability (such as El Nino/ La Nina) that may be occurring at cycles of every 7, 11, or even 30 years.
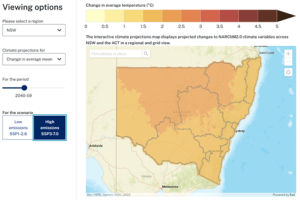
Climate projection tools such as NSW’s NARCliM do not attempt to reproduce the timing or sequencing of individual events. Their value lies in describing how the background climate envelope is expected to shift – generally higher temperature distributions, increased atmospheric moisture capacity, and a greater tendency toward intense rainfall when it does occur. Importantly, these projections are consistent with observations that anyone can make by looking at BOM data, freely available from the BOM Climate Data website.
The period from 2018 through to 2022 provides a useful illustration of how these conditions can play out. Extreme heat and fire conditions over several years were followed by flooding in 2020, with further major flood events over the following 18 months or so, particularly across coastal New South Wales and south-east Queensland. The heatwave / fire / flood sequence that has played out in parts of NSW and Victoria recently, shares some similar dynamics. Often, the flood events that follow heatwaves and fires occur in subsequent years that are cooler on average, yet still produced severe impacts, reinforcing that risk is not well explained by averages alone. As temperatures increase over the coming decades, expect disproportionately larger effects on climate volatility and extremes.
Climate risk assessment
This nuanced way of examining climate risk closely reflects the issues identified in the Commonwealth’s 2025 Climate Risk assessment, particularly the emphasis on compound hazards, variability, and the limits of historical statistics. It also aligns with ASRS climate scenario disclosure requirements, which increasingly focus on how physical climate risks may evolve over various planning horizons, with the shorter term time horizons (2030- 2040) being of particular relevance for priority business planning. In that context, long-term trend analysis of local observed data is especially valuable – not as a substitute for global climate change scenarios, but as a way to ground them and better understand near-term, local risk.
Climate risk assessment is also a critical component of contemporary infrastructure design and management, requiring a structured, forward-looking approach that goes beyond reliance on historical climate data. In Australia, this is typically undertaken using recognised frameworks such as AS 5334 Climate change adaptation for settlements and infrastructure, supported by national climate projections from CSIRO, and delivery frameworks like the Green Star and Infrastructure Sustainability (IS) rating schemes. These standards and guidelines emphasise scenario-based assessment, consideration of long asset lifespans, and a focus on service criticality. When applied effectively, it can enable infrastructure owners and decision-makers to identify material physical risks, prioritise adaptation measures, and inform resilient design, which will ultimately improve the long-term sustainability of infrastructure assets.
Take action
If you need help analysing climate trends and forecasts, guidance on ASRS risk assessment, or advice on infrastructure sustainability, you can reach out to Barbara, Yusi or Ian.
If you need help developing a climate transition strategy and action plan, or a climate risk assessment, contact us today to learn how we can support your transition. Reach out to Barbara or Patrick for more information.
Feel free to use an excerpt of this blog on your own site, newsletter, blog, etc. Just send us a copy or link and include the following text at the end of the excerpt: “This content is reprinted from 100% Renewables Pty Ltd’s blog.


 Your download is ready!